How to Share GPUs in Kubernetes at Scale with HAMi (Software vGPU Slicing)
Share NVIDIA GPUs in Kubernetes with HAMi software vGPU slicing: memory and compute limits, Helm configuration, a verified PyTorch manifest, a real RTX PRO 6000 OOM test, and Prometheus monitoring.


Thanks to our hardware partner


This deep dive ran on an 8x NVIDIA RTX PRO 6000 Blackwell node from Utho Cloud. If you need GPU infrastructure to run workloads like these, take a look.
Explore UthoOn this page (34)
- The Problem: Fixed Hardware Profiles vs. Flexible Software Budgets
- Before Installing HAMi: The Four Layers
- Build the Kubernetes 1.35 Cluster
- Make the NVIDIA runtime the default
- Initialize the control plane
- RuntimeClass and GPU Operator: Which Path Are We Using?
- Install HAMi From Scratch
- Where did nvidia.com/gpu come from?
- How HAMi's Architecture Differs from the MIG Stack
- HAMi mutating webhook
- hami-scheduler (cluster-wide)
- hami-device-plugin (DaemonSet, one per GPU node)
- hami-core (the actual enforcement mechanism)
- What “80 GPUs” Means on an Eight-GPU Node
- Verify the count yourself
- Reading the Helm Values That Control the Split
- How to Request vGPU Slices in a Pod Spec
- The exact two-container test
- Prove that memory budget beats free count slots
- Fixed MiB or percentage?
- How to Verify Where a Slice Landed
- Software Isolation vs. Hardware Isolation
- Testing the Blast Radius: What Happens When a Pod Exceeds Its Memory Quota
- Step 1: Spike memory usage from inside the pod
- Step 2: Check the offending container, neighbor, and host
- Monitoring the Slices
- Common Pitfalls and How to Solve Them
- Pitfall A: Assuming nvidia.com/gpu Count Reflects Physical GPU Count
- Pitfall B: Expecting nvidia.com/gpu: 1 Alone to Mean “One Tenth”
- Pitfall C: Treating requests and limits Differently
- Pitfall D: Removing runtimeClassName Without Checking the Runtime
- Pitfall E: Blaming HAMi for a Slow First Deployment
- Pitfall F: Treating HAMi-Core Limits as Hardware-Equivalent to MIG
- Conclusion
Your platform team did everything right. You bought MIG-capable GPUs, carved them into hardware-isolated slices exactly like we did in the MIG deep dive, and stopped handing a whole 96GB card to every notebook that asked for one. And yet the tickets keep coming.
One team needs 8GB of VRAM, but the smallest MIG profile on our RTX PRO 6000 is 1g.24gb. That leaves most of the slice unused. Another workload needs 30GB, which does not match the available 24GB or 48GB profiles cleanly. Changing a MIG geometry also means stopping workloads that occupy the instances you need to destroy and recreate.
On Ampere GPUs, toggling MIG mode itself can additionally require a GPU reset; Hopper and newer GPUs no longer require that reset. NVIDIA documents the exact RTX PRO 6000 profiles and the generation-specific reset behavior.
Then there is the rest of the fleet: NVIDIA cards that do not support MIG, or clusters where fixed hardware partitions are simply the wrong fit. Kubernetes normally treats a GPU as an indivisible extended resource, so a pod asking for one GPU can occupy a whole card even when it uses only a small part of the memory and compute.
HAMi (Heterogeneous AI Computing Virtualization Middleware) adds a software sharing layer. In plain English, it gives Kubernetes three numbers to work with:
- How many physical GPUs does this container need?
nvidia.com/gpu - How much memory may it use on each GPU?
nvidia.com/gpumem, in MiB - How much compute time may it receive?
nvidia.com/gpucores, in 1% steps
HAMi is now a CNCF Incubating project, and its maintained device support matrix covers NVIDIA plus several other accelerator families through vendor-specific plugins.
This walkthrough runs on our actual test rig: 8 NVIDIA RTX PRO 6000 Blackwell Server Edition GPUs. All eight cards are in non-MIG mode, and deviceSplitCount: 10 makes Kubelet report 8 × 10 = 80 logical scheduling slots. That does not create 80 GPUs or multiply the machine's VRAM. It creates 80 scheduling slots backed by the same eight cards. The exact live command and output appear below.
For this guide, we rebuilt that node as a clean single-node Kubernetes v1.35.6 cluster, installed HAMi v2.9.0 as a new Helm release, and then ran the sharing and quota tests you will see below. The point is not merely to show the final YAML. It is to make every software layer between the physical GPU and the pod understandable.
Who this is for:
- Platform engineers who already run (or have evaluated) NVIDIA MIG and want to know what changes when isolation moves from silicon to software.
- Teams who need finer-grained GPU fractions than MIG's fixed profiles allow, or whose cards don't support MIG at all.
What you'll get from this guide:
- Why a GPU node may advertise more scheduling units than physical cards, what that number means, and what actually limits placement.
- A mental model for how HAMi enforces memory and compute limits without touching the hardware's memory crossbars.
- The exact Helm values that control the split factor, and how to size a workload's
nvidia.com/gpumem/nvidia.com/gpucoresrequests. - A verified Deployment manifest running a PyTorch workload against a HAMi vGPU slice on a Blackwell (
sm_120) card. - A concrete blast-radius test with captured output: one pod's process allocates past its memory grant while a second pod shares the same physical card.
The lab has one Kubernetes node, so this post does not pretend to benchmark multi-node scheduling. The same device-plugin architecture extends to every labeled GPU node, but cluster-scale policy and failure testing are separate exercises.
The Problem: Fixed Hardware Profiles vs. Flexible Software Budgets #
MIG solves the "one pod locks a whole 96GB card" problem by carving the GPU into hardware-isolated partitions. On this RTX PRO 6000, those partitions come in fixed profiles such as 1g.24gb, 2g.48gb, and 4g.96gb.
That creates its own friction:
- If a workload needs 8GB, the smallest standard compute profile on this card is still 24GB. You waste less than with a whole card, but you still waste 16GB.
- A workload that needs 30GB does not fit the 24GB profile, so it must take 48GB.
- Changing the profile layout requires destroying and recreating affected MIG instances. That is operationally heavier than changing a pod resource request.
- MIG only works on supported GPUs and software combinations. It is not a universal sharing mechanism for every NVIDIA card.
HAMi takes a different approach. Instead of partitioning the silicon, its NVIDIA path combines device-aware scheduling with HAMi-Core, an injected user-space library. The hami-scheduler reserves a memory and compute budget; HAMi-Core tracks supported CUDA allocations and throttles compute while the container runs. The official GPU virtualization walkthrough documents the complete webhook → scheduler → device plugin → HAMi-Core flow.
That means:
- Memory can be requested in 1 MiB units:
nvidia.com/gpumem: 8000is valid, rather than choosing a fixed profile name. - No GPU reset is required to change how a card is divided. The limits live in the pod spec, not the hardware.
- Compute can be requested in 1% steps with
nvidia.com/gpucores. - HAMi provides a common scheduling model across multiple accelerator families, with capabilities and plugins that vary by vendor. This article tests only the NVIDIA HAMi-Core path.
The tradeoff is the boundary. HAMi's NVIDIA limits are enforced in user space by intercepting CUDA/NVML paths. MIG's memory and compute boundaries are implemented in hardware. Both can prevent an ordinary CUDA workload from consuming another tenant's allocation, but they are not equivalent isolation guarantees.
Animated request path
Scheduling decides where; HAMi-Core controls what happens inside
A memory request is checked before placement, then enforced again when the application actually allocates VRAM.
Before Installing HAMi: The Four Layers #
GPU setup becomes confusing when four different jobs are described as if they were one installation. Keep this stack in your head:
- NVIDIA driver: lets Linux communicate with the physical GPU.
nvidia-smiproves this layer works. - NVIDIA Container Toolkit: lets a container runtime expose that GPU inside a container.
- Kubernetes: places pods on nodes and asks a device plugin for the devices assigned to each container.
- HAMi: replaces whole-GPU scheduling with device-aware placement plus software memory and compute limits.
HAMi does not replace the driver, Container Toolkit, containerd, or Kubernetes. It builds on them.
Our clean test node used:
- Host OS: Ubuntu 24.04.4 LTS on Utho Cloud.
- Kubernetes: v1.35.6, one control-plane node (
utho-gpu-rtxpro6000-8-62383). - Container runtime: containerd 2.2.1.
- GPUs: 8x NVIDIA RTX PRO 6000 Blackwell Server Edition.
- Memory per GPU: 97,887 MiB reported by the driver.
- NVIDIA driver: 610.43.02.
- NVIDIA Container Toolkit: 1.19.1.
root@utho-gpu-rtxpro6000-8-62383:~# nvidia-smi -L
GPU 0: NVIDIA RTX PRO 6000 Blackwell Server Edition (UUID: GPU-8b89b58e-b427-108d-ac50-06138d78fe78)
GPU 1: NVIDIA RTX PRO 6000 Blackwell Server Edition (UUID: GPU-03a041b7-8abf-360a-d1a2-dfd70188cd5f)
GPU 2: NVIDIA RTX PRO 6000 Blackwell Server Edition (UUID: GPU-ba09367f-dd50-32ca-e988-7ff66bece885)
GPU 3: NVIDIA RTX PRO 6000 Blackwell Server Edition (UUID: GPU-30512c46-708b-f374-5698-ee24be6cd626)
GPU 4: NVIDIA RTX PRO 6000 Blackwell Server Edition (UUID: GPU-4c395b7a-a7e6-d90f-1ced-d96e8dd68288)
GPU 5: NVIDIA RTX PRO 6000 Blackwell Server Edition (UUID: GPU-04dc48d7-7048-aef5-ad36-f5db716e7668)
GPU 6: NVIDIA RTX PRO 6000 Blackwell Server Edition (UUID: GPU-f4f5db98-143f-0a8d-47ce-956fab39a736)
GPU 7: NVIDIA RTX PRO 6000 Blackwell Server Edition (UUID: GPU-f4c61521-240a-da09-2787-e576034e197e)
Build the Kubernetes 1.35 Cluster #
If you already have a healthy Kubernetes cluster, do not reset it just to follow this guide. We rebuilt a dedicated test node so the installation path was clean. The package commands below follow Kubernetes' official kubeadm installation guide.
First enable the kernel settings Kubernetes networking needs and turn off swap:
sudo swapoff -a
sudo modprobe overlay
sudo modprobe br_netfilter

cat <<'EOF' | sudo tee /etc/sysctl.d/99-kubernetes-cri.conf
net.bridge.bridge-nf-call-iptables  = 1
net.bridge.bridge-nf-call-ip6tables = 1
net.ipv4.ip_forward                 = 1
EOF

sudo sysctl --system
swapoff -a changes the running system only. If this node may reboot, also disable its swap entry in /etc/fstab or the corresponding systemd swap unit before treating the cluster as persistent.
Add the Kubernetes v1.35 package repository and install the node tools:
sudo apt-get update
sudo apt-get install -y apt-transport-https ca-certificates curl gpg
sudo mkdir -p -m 755 /etc/apt/keyrings

curl -fsSL https://pkgs.k8s.io/core:/stable:/v1.35/deb/Release.key \
  | sudo gpg --dearmor -o /etc/apt/keyrings/kubernetes-apt-keyring.gpg

echo 'deb [signed-by=/etc/apt/keyrings/kubernetes-apt-keyring.gpg] https://pkgs.k8s.io/core:/stable:/v1.35/deb/ /' \
  | sudo tee /etc/apt/sources.list.d/kubernetes.list

sudo apt-get update
sudo apt-get install -y kubelet kubeadm kubectl
sudo apt-mark hold kubelet kubeadm kubectl
Make the NVIDIA runtime the default #
The host already had its NVIDIA driver and Container Toolkit. We configured containerd with the NVIDIA runtime and made it the default, which is also the setup expected by HAMi's prerequisites:
sudo nvidia-ctk runtime configure \
  --runtime=containerd \
  --set-as-default
sudo systemctl restart containerd
Verify the result instead of assuming it worked:
root@utho-gpu-rtxpro6000-8-62383:~# containerd config dump \
  | grep -E 'default_runtime_name|BinaryName' | head -2
      default_runtime_name = 'nvidia'
            BinaryName = '/usr/bin/nvidia-container-runtime'
Initialize the control plane #
The 10.244.0.0/16 pod network below matches Flannel's default manifest:
PUBLIC_IP="<PUBLIC_IP>"

sudo kubeadm init \
  --kubernetes-version v1.35.6 \
  --apiserver-advertise-address "$PUBLIC_IP" \
  --pod-network-cidr 10.244.0.0/16 \
  --cri-socket unix:///run/containerd/containerd.sock

mkdir -p "$HOME/.kube"
sudo cp /etc/kubernetes/admin.conf "$HOME/.kube/config"
sudo chown "$(id -u):$(id -g)" "$HOME/.kube/config"
This is a one-node lab, so the control-plane node must also accept workloads. Do not remove this taint on a production control plane unless that is an intentional design decision:
kubectl taint nodes --all node-role.kubernetes.io/control-plane-
kubectl apply -f \
  https://github.com/flannel-io/flannel/releases/download/v0.28.7/kube-flannel.yml
The rebuilt node came up on the expected versions:
NAME                          STATUS   KUBERNETES   RUNTIME
utho-gpu-rtxpro6000-8-62383   Ready    v1.35.6      containerd://2.2.1
RuntimeClass and GPU Operator: Which Path Are We Using? #
It is reasonable to expect an nvidia RuntimeClass if you normally install GPUs through the NVIDIA GPU Operator. Many Operator configurations create it.
That is not a universal rule anymore. In current GPU Operator releases, ordinary CDI (Container Device Interface)-injected workloads do not need to name a RuntimeClass, and enabling the newer NRI plugin deliberately removes the nvidia RuntimeClass. NVIDIA documents those mode differences in its CDI and NRI guide.
This lab does not install GPU Operator. The host already has the driver and Container Toolkit, and containerd's default runtime is nvidia. Therefore:
root@utho-gpu-rtxpro6000-8-62383:~# kubectl get runtimeclass
No resources found
That empty output is correct for this setup. The later workload works without runtimeClassName because the NVIDIA runtime is already the default.
If your cluster already uses GPU Operator, do not run two device plugins that both advertise nvidia.com/gpu. HAMi's GPU Operator compatibility guidance says to disable the Operator-managed device plugin (devicePlugin.enabled=false) when HAMi owns NVIDIA GPU scheduling. Keep the Operator for the driver/toolkit lifecycle if you need it; let HAMi own the conflicting device-plugin role.
Install HAMi From Scratch #
HAMi's NVIDIA device plugin selects nodes labeled gpu=on by default, so label the GPU node first:
kubectl label node utho-gpu-rtxpro6000-8-62383 gpu=on --overwriteNow install a pinned HAMi chart. We pin its bundled kube-scheduler sidecar to the same version as the API server. Kubernetes' version-skew policy expects the same minor version and permits the scheduler to be one minor older; an exact match simply removes avoidable skew from this lab. Notice the full Helm path, scheduler.kubeScheduler.image.tag; scheduler.kubeScheduler.imageTag is not a chart 2.9.0 value and would be silently ignored. The remaining values make the sharing policy explicit instead of hiding important behavior behind defaults:
helm repo add hami-charts https://project-hami.github.io/HAMi/
helm repo update hami-charts

K8S_VERSION=$(kubectl version -o json | jq -r '.serverVersion.gitVersion')

helm install hami hami-charts/hami \
  --version 2.9.0 \
  --namespace hami-system \
  --create-namespace \
  --wait \
  --timeout 10m \
  --set scheduler.kubeScheduler.image.tag="$K8S_VERSION" \
  --set devicePlugin.deviceSplitCount=10 \
  --set devicePlugin.deviceMemoryScaling=1 \
  --set devicePlugin.deviceCoreScaling=1 \
  --set devicePlugin.migStrategy=none \
  --set devicePlugin.createRuntimeClass=false \
  --set-string devicePlugin.disablecorelimit=false
This is the release created by that command, not a dry-run render or an inherited installation:
NAME   NAMESPACE    REVISION   STATUS     CHART        APP VERSION
hami   hami-system  1          deployed   hami-2.9.0   2.9.0
Both HAMi components became healthy:
NAME                              READY   STATUS    RESTARTS
hami-device-plugin-5wdzg          2/2     Running   0
hami-scheduler-6f74879cc7-9fddb   2/2     Running   0
The scheduler pod is cluster-wide. The device-plugin DaemonSet runs once on every selected GPU node. During the final review, we read the capacity and allocatable values directly from the live Node object:
root@utho-gpu-rtxpro6000-8-62383:~# kubectl get node utho-gpu-rtxpro6000-8-62383 \
  -o custom-columns='NAME:.metadata.name,KUBERNETES:.status.nodeInfo.kubeletVersion,GPU-CAPACITY:.status.capacity.nvidia\.com/gpu,GPU-ALLOCATABLE:.status.allocatable.nvidia\.com/gpu'
NAME                          KUBERNETES   GPU-CAPACITY   GPU-ALLOCATABLE
utho-gpu-rtxpro6000-8-62383   v1.35.6      80             80
That 80 is the real output from the all-eight non-MIG configuration: eight registered physical cards, each contributing ten logical device IDs.
Where did nvidia.com/gpu come from? #
Not from RuntimeClass, and not directly from GPU Operator. A device plugin is the component that registers an extended resource with Kubelet.
In a typical GPU Operator installation, the Operator deploys NVIDIA's official device plugin, which registers nvidia.com/gpu. In this installation, there is no GPU Operator or NVIDIA device-plugin DaemonSet. The HAMi chart installed hami-device-plugin, and that plugin owns the same resource name:
NAME                 READY   DESIRED   IMAGE
hami-device-plugin   1       1         docker.io/projecthami/hami:v2.9.0
The live sequence is:
- The host NVIDIA driver exposes eight physical GPUs.
hami-device-plugindiscovers and registers all eight whole GPUs.- It connects to Kubelet's Device Plugin API and registers the configured resource name,
nvidia.com/gpu. deviceSplitCount: 10makes each registered whole GPU contribute ten schedulable device IDs.- Kubelet publishes
8 × 10 = 80as the node'snvidia.com/gpucapacity.
This came from the HAMi device-plugin container log, not from Kubelet or the NVIDIA GPU Operator:
PLUGIN_POD=$(kubectl get pod -n hami-system \
  -l app.kubernetes.io/component=hami-device-plugin \
  -o jsonpath='{.items[0].metadata.name}')

kubectl logs -n hami-system "$PLUGIN_POD" -c device-plugin \
  | grep -E 'Discovered [0-9]+ device\(s\) for registration' \
  | tail -1
I0723 09:53:36.227471 1910347 register.go:197] Discovered 8 device(s) for registration
The node's hami.io/node-nvidia-register annotation records "count": 10 for each of those eight registered GPU UUIDs. The physical inventory and MIG state agree:
root@utho-gpu-rtxpro6000-8-62383:~# nvidia-smi \
  --query-gpu=index,name,mig.mode.current --format=csv,noheader
0, NVIDIA RTX PRO 6000 Blackwell Server Edition, Disabled
1, NVIDIA RTX PRO 6000 Blackwell Server Edition, Disabled
2, NVIDIA RTX PRO 6000 Blackwell Server Edition, Disabled
3, NVIDIA RTX PRO 6000 Blackwell Server Edition, Disabled
4, NVIDIA RTX PRO 6000 Blackwell Server Edition, Disabled
5, NVIDIA RTX PRO 6000 Blackwell Server Edition, Disabled
6, NVIDIA RTX PRO 6000 Blackwell Server Edition, Disabled
7, NVIDIA RTX PRO 6000 Blackwell Server Edition, Disabled
That is why the host has eight GPUs while this live HAMi registration contributes 80 logical slots. Without either HAMi's device plugin or NVIDIA's official device plugin, nvidia-smi could work perfectly on the host while Kubernetes would advertise no nvidia.com/gpu capacity.
This also explains the conflict warning above: HAMi's plugin and NVIDIA's official plugin should not both try to own nvidia.com/gpu on the same node.
The nvcr.io/nvidia/pytorch:25.01-py3 image used later is an official NGC image. NVIDIA's 25.01 release notes mark that release as optimized for Blackwell, and our test confirmed compute capability (12, 0) on this RTX PRO 6000.
How HAMi's Architecture Differs from the MIG Stack #
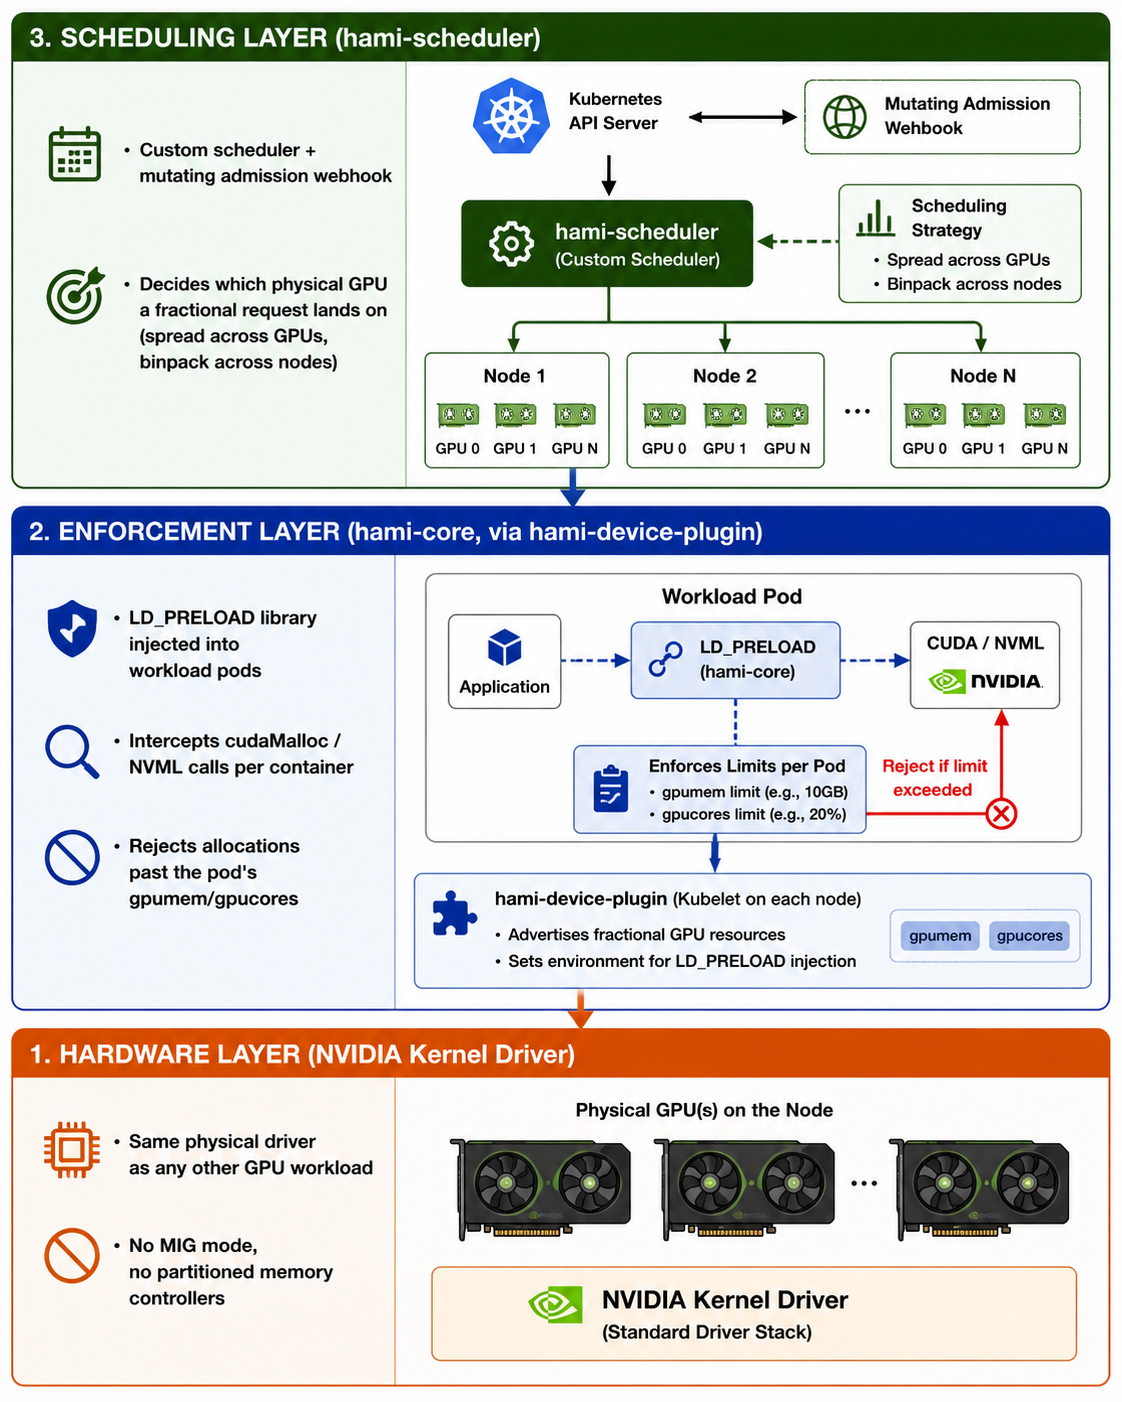
The MIG stack first creates hardware instances, then the NVIDIA device plugin advertises those instances to Kubernetes. HAMi leaves the physical GPU unpartitioned in hami-core mode and coordinates four software responsibilities instead: admission, placement, device injection, and in-container enforcement.
HAMi mutating webhook #
When a pod requests HAMi-managed resources, the webhook routes it to hami-scheduler. It does not send every ordinary pod through HAMi. A CPU-only sanity-check pod on the rebuilt cluster retained schedulerName: default-scheduler, while the GPU test pods reported schedulerName: hami-scheduler.
hami-scheduler (cluster-wide) #
The HAMi scheduler pod contains a Kubernetes scheduler instance plus HAMi's extender logic. During Filter, it rejects nodes or cards that lack a free sharing slot, requested VRAM, or requested compute. During Score, it applies the configured binpack/spread policy. During Bind, it chooses a physical GPU UUID and records the allocation in pod annotations. The official architecture documentation describes these roles separately.
hami-device-plugin (DaemonSet, one per GPU node) #
Registers the logical GPU count with Kubelet, publishes each physical card's UUID/memory/core information in node annotations, and reads the scheduler's chosen allocation from the pod annotation. During the Device Plugin Allocate call it exposes /dev/nvidia*, mounts libvgpu.so and /etc/ld.so.preload, and injects limit variables into the container. Its vgpu-monitor sidecar exports real-time usage metrics; the OOM message itself is emitted by HAMi-Core inside the workload process.
hami-core (the actual enforcement mechanism) #
This is the shared library, libvgpu.so, that HAMi mounts into a managed NVIDIA workload container. /etc/ld.so.preload causes the dynamic linker to load it into processes before CUDA/NVML libraries. It intercepts supported calls used to allocate/query memory and throttles kernel launches for compute control. The HAMi-Core design places it between the CUDA runtime and driver.
When a container's tracked allocation would exceed its configured nvidia.com/gpumem limit, HAMi-Core returns an OOM on that intercepted path even if the physical card still has free memory. This is also why nvidia-smi inside a HAMi container reports its virtualized total instead of the card's real 97887 MiB: the relevant NVML memory query is intercepted too.
Here is the mechanism from one of the fresh 8,000 MiB / 10% test containers:
root@utho-gpu-rtxpro6000-8-62383:~# kubectl exec \
  -n hami-blog-verify pytorch-hami-demo-77b6f5dcd9-whrbg -- \
  sh -c 'cat /etc/ld.so.preload; printf "CUDA_DEVICE_MEMORY_LIMIT_0=%s\n" "$CUDA_DEVICE_MEMORY_LIMIT_0"; printf "CUDA_DEVICE_SM_LIMIT=%s\n" "$CUDA_DEVICE_SM_LIMIT"'
/usr/local/vgpu/libvgpu.so
CUDA_DEVICE_MEMORY_LIMIT_0=8000m
CUDA_DEVICE_SM_LIMIT=10
No runtimeClassName appears in our pod because the node uses nvidia-container-runtime by default and this chart was installed with devicePlugin.createRuntimeClass: false. HAMi still depends on the NVIDIA Container Toolkit/runtime; omitting the field does not mean that layer is unnecessary.
What “80 GPUs” Means on an Eight-GPU Node #
This node advertises nvidia.com/gpu: 80 even though nvidia-smi -L lists eight physical cards. The missing mental model is simple:
deviceSplitCount: 10means up to ten separate workload containers may share one physical GPU.nvidia.com/gpu: 1means the container needs one physical GPU in its device set. It does not mean “one tenth of a GPU,” and a single container cannot request two logical slots from the same card by setting this to2.nvidia.com/gpumemandnvidia.com/gpucoresdescribe the per-GPU budget for that container.
The arithmetic is 8 HAMi-registered whole GPUs × 10 possible sharing workloads = 80 schedulable GPU units. The node still has only eight physical memory systems and eight sets of SMs.
Scheduling math
Eight physical GPUs can expose 80 slots without becoming 80 GPUs
HAMi multiplies how many containers may share a card. It does not multiply the card's memory or compute.
deviceSplitCount is a concurrency ceiling. Memory and core requests still have to fit the real card.
The chart defaults to 10, but the right value is a concurrency choice, not a performance promise. A smaller number reduces how many containers can contend on one card. A larger number permits more tiny workloads, but adds more contexts, more neighbors, and more operational complexity. Setting it to 1 restores exclusive placement: only one workload can occupy each physical GPU.
With deviceMemoryScaling: 1 and deviceCoreScaling: 1, the scheduler also checks the real aggregate budget. It does not admit a pod merely because a count slot is free. After deploying the two 8,000 MiB replicas in the next section, we prove this with a separate 90,000 MiB pod. Its complete manifest, commands, and captured CardInsufficientMemory event are included there.
That scheduler decision is not an OOM: the rejected container never starts. A real runtime OOM happens when an admitted container allocates beyond its own grant. We reproduce that separately in the blast-radius test.
The practical upside is density without fixed profile sizes. A notebook can request 8,000 MiB, a small inference replica 12,000 MiB, and another workload 20,000 MiB, as long as the total count, memory, and compute requests all fit. The practical costs are shared-hardware contention and a software isolation boundary, so latency-sensitive or adversarial tenants may still deserve MIG or dedicated GPUs.
Verify the count yourself #
The split factor appears in hami.io/node-nvidia-register, where each registered whole GPU has "count": 10. The simplest summary is the live node capacity:
root@utho-gpu-rtxpro6000-8-62383:~# kubectl get node utho-gpu-rtxpro6000-8-62383 \
  -o custom-columns='NAME:.metadata.name,KUBERNETES:.status.nodeInfo.kubeletVersion,GPU-CAPACITY:.status.capacity.nvidia\.com/gpu,GPU-ALLOCATABLE:.status.allocatable.nvidia\.com/gpu'
NAME                          KUBERNETES   GPU-CAPACITY   GPU-ALLOCATABLE
utho-gpu-rtxpro6000-8-62383   v1.35.6      80             80
The node's capacity confirms 8 × 10 = 80, while nvidia-smi -L remains the source of truth for the eight-card physical inventory.
Reading the Helm Values That Control the Split #
The count: 10 comes straight from the live Helm release's computed values. Here are only the fields that affect this walkthrough; the full output also contains image, service, security-context, and vendor configuration:
root@utho-gpu-rtxpro6000-8-62383:~# helm get values -n hami-system hami --alldevicePlugin:
deviceSplitCount: 10
deviceMemoryScaling: 1
deviceCoreScaling: 1
migStrategy: none
disablecorelimit: "false"
createRuntimeClass: false
runtimeClassName: ""
nvidiaNodeSelector:
gpu: "on"
resourceName: nvidia.com/gpu
resourceMem: nvidia.com/gpumem
resourceMemPercentage: nvidia.com/gpumem-percentage
resourceCores: nvidia.com/gpucores
scheduler:
defaultSchedulerPolicy:
gpuSchedulerPolicy: spread
nodeSchedulerPolicy: binpackThe current HAMi configuration reference defines the semantics:
deviceSplitCount: 10is the maximum number of workload containers HAMi may assign to one physical GPU.1means exclusive placement, not fractional sharing.deviceMemoryScaling: 1means the schedulable memory budget equals physical memory. Values above1deliberately advertise more memory than exists; HAMi documents memory overcommit as experimental, and a real physical OOM becomes possible if tenants use all promised memory together.deviceCoreScaling: 1keeps the aggregate schedulable compute budget at 100% per card.disablecorelimit: "false"enables HAMi-Core's compute limiting path. Core control is time-based throttling, sonvidia-smiutilization can fluctuate around the requested percentage rather than drawing a perfectly flat line.migStrategy: nonemeans HAMi is not layering on top of MIG partitions here; it's doing purehami-coresoftware slicing against whole physical GPUs.nvidiaNodeSelector.gpu: "on"restricts the device plugin to nodes labeledgpu=on, which matches the label already on this node.gpuSchedulerPolicy: spreadprefers different physical cards;nodeSchedulerPolicy: binpackprefers already-used nodes. For the same-GPU isolation test, relying on a preference is not precise enough, so the manifest below pins a known idle GPU UUID.
How to Request vGPU Slices in a Pod Spec #
Where a MIG manifest requests a fixed profile (nvidia.com/mig-1g.24gb: 1), a HAMi manifest can request three independent values:
One unit detail matters throughout the test: gpumem is measured in MiB. One MiB is 1,048,576 bytes, so 8,000 MiB is 8,388,608,000 bytes or 7.8125 GiB. That is why HAMi accepts 8000 while PyTorch later prints 7.81 GiB; the numbers describe the same capacity.
resources:
  limits:
    nvidia.com/gpu: 1 # use one physical GPU, possibly shared with other containers
    nvidia.com/gpumem: 8000 # reserve and expose 8000 MiB on that GPU
    nvidia.com/gpucores: 10 # request 10% of that GPU's compute time
Kubernetes extended resources belong in limits; if you also write requests, they must match. This manifest includes both explicitly.
The exact two-container test #
For an ordinary workload, let HAMi choose a card. For a blast-radius test, both replicas must share the same card, so I pinned them to idle GPU 5 with nvidia.com/use-gpuuuid. The additional binpack annotation states the intent, while the UUID makes the result deterministic. Replace the UUID for your node, or remove both annotations outside a test.
I kept the workload out of the hami-system control-plane namespace:
kubectl create namespace hami-blog-verifyapiVersion: apps/v1
kind: Deployment
metadata:
name: pytorch-hami-demo
namespace: hami-blog-verify
labels:
app: pytorch-hami-demo
spec:
replicas: 2
selector:
matchLabels:
app: pytorch-hami-demo
template:
metadata:
labels:
app: pytorch-hami-demo
annotations:
# Test-only pin so both replicas definitely share GPU 5.
nvidia.com/use-gpuuuid: "GPU-04dc48d7-7048-aef5-ad36-f5db716e7668"
hami.io/gpu-scheduler-policy: "binpack"
spec:
containers:
- name: pytorch
image: nvcr.io/nvidia/pytorch:25.01-py3
command: ["python3", "-c"]
args:
- |
import torch
import time
print("=== CUDA vGPU Slice Diagnostics ===", flush=True)
print("CUDA Available:", torch.cuda.is_available(), flush=True)
if torch.cuda.is_available():
print("Device Name:", torch.cuda.get_device_name(0), flush=True)
print("Device Capability:", torch.cuda.get_device_capability(0), flush=True)
print("CUDA Device Count:", torch.cuda.device_count(), flush=True)
print("Allocating tensors and starting matrix math...", flush=True)
device = torch.device("cuda")
x = torch.randn(10000, 10000, device=device)
y = torch.randn(10000, 10000, device=device)
while True:
z = torch.matmul(x, y)
time.sleep(0.5)
else:
print("ERROR: CUDA is not available!", flush=True)
time.sleep(3600)
resources:
limits:
nvidia.com/gpu: 1
nvidia.com/gpumem: 8000
nvidia.com/gpucores: 10
requests:
nvidia.com/gpu: 1
nvidia.com/gpumem: 8000
nvidia.com/gpucores: 10Apply it and wait for both replicas:
root@utho-gpu-rtxpro6000-8-62383:~# kubectl apply -f pytorch-hami-demo.yaml
deployment.apps/pytorch-hami-demo created

root@utho-gpu-rtxpro6000-8-62383:~# kubectl rollout status \
  deployment/pytorch-hami-demo -n hami-blog-verify --timeout=180s
deployment "pytorch-hami-demo" successfully rolled out
Read the startup logs:
root@utho-gpu-rtxpro6000-8-62383:~# kubectl logs \
  -n hami-blog-verify -l app=pytorch-hami-demo \
  --prefix --tail=20 \
  | grep -E 'CUDA Available|Device Name|Device Capability|CUDA Device Count'
[pod/pytorch-hami-demo-77b6f5dcd9-whrbg/pytorch] CUDA Available: True
[pod/pytorch-hami-demo-77b6f5dcd9-whrbg/pytorch] Device Name: NVIDIA RTX PRO 6000 Blackwell Server Edition
[pod/pytorch-hami-demo-77b6f5dcd9-whrbg/pytorch] Device Capability: (12, 0)
[pod/pytorch-hami-demo-77b6f5dcd9-whrbg/pytorch] CUDA Device Count: 1
[pod/pytorch-hami-demo-77b6f5dcd9-wx677/pytorch] CUDA Available: True
[pod/pytorch-hami-demo-77b6f5dcd9-wx677/pytorch] Device Name: NVIDIA RTX PRO 6000 Blackwell Server Edition
[pod/pytorch-hami-demo-77b6f5dcd9-wx677/pytorch] Device Capability: (12, 0)
[pod/pytorch-hami-demo-77b6f5dcd9-wx677/pytorch] CUDA Device Count: 1
Both placement annotations name GPU 5 and the same 8,000 MiB / 10% grant:
root@utho-gpu-rtxpro6000-8-62383:~# kubectl get pods \
  -n hami-blog-verify -l app=pytorch-hami-demo \
  -o custom-columns='NAME:.metadata.name,ALLOCATION:.metadata.annotations.hami\.io/vgpu-devices-allocated'
NAME                                 ALLOCATION
pytorch-hami-demo-77b6f5dcd9-whrbg   GPU-04dc48d7-7048-aef5-ad36-f5db716e7668,NVIDIA,8000,10:;
pytorch-hami-demo-77b6f5dcd9-wx677   GPU-04dc48d7-7048-aef5-ad36-f5db716e7668,NVIDIA,8000,10:;
Inside either container, nvidia-smi shows the virtualized view:
root@utho-gpu-rtxpro6000-8-62383:~# kubectl exec \
  -n hami-blog-verify pytorch-hami-demo-77b6f5dcd9-whrbg -- \
  sh -c 'nvidia-smi --query-gpu=uuid,name,memory.total,memory.used --format=csv,noheader 2>/dev/null'
GPU-04dc48d7-7048-aef5-ad36-f5db716e7668, NVIDIA RTX PRO 6000 Blackwell Server Edition, 8000 MiB, 2107 MiB
The host sees the two real processes on the same physical UUID:
root@utho-gpu-rtxpro6000-8-62383:~# nvidia-smi \
  --query-compute-apps=gpu_uuid,pid,used_memory --format=csv,noheader \
  | grep 'GPU-04dc48d7-7048-aef5-ad36-f5db716e7668'
GPU-04dc48d7-7048-aef5-ad36-f5db716e7668, 1932078, 2110 MiB
GPU-04dc48d7-7048-aef5-ad36-f5db716e7668, 1932782, 2110 MiB
The few-MiB difference between in-container and host accounting is normal tool/accounting overhead. The important facts are the shared UUID and each container's separate 8,000 MiB view.
Prove that memory budget beats free count slots #
At this point, two of GPU 5's ten count slots are occupied. The allocation annotation proves that both 8,000 MiB reservations landed on the same physical card:
root@utho-gpu-rtxpro6000-8-62383:~# kubectl get pods \
  -n hami-blog-verify -l app=pytorch-hami-demo \
  -o custom-columns='NAME:.metadata.name,ALLOCATION:.metadata.annotations.hami\.io/vgpu-devices-allocated'
NAME                                 ALLOCATION
pytorch-hami-demo-77b6f5dcd9-whrbg   GPU-04dc48d7-7048-aef5-ad36-f5db716e7668,NVIDIA,8000,10:;
pytorch-hami-demo-77b6f5dcd9-wx677   GPU-04dc48d7-7048-aef5-ad36-f5db716e7668,NVIDIA,8000,10:;
Eight count slots are still free, but only 97,887 - 8,000 - 8,000 = 81,887 MiB remains in HAMi's scheduling budget for that card. This third pod deliberately asks for 90,000 MiB:
apiVersion: v1
kind: Pod
metadata:
  name: hami-too-large
  namespace: hami-blog-verify
  annotations:
    nvidia.com/use-gpuuuid: "GPU-04dc48d7-7048-aef5-ad36-f5db716e7668"
spec:
  restartPolicy: Never
  containers:
    - name: too-large
      image: ubuntu:22.04
      command: ["sleep", "3600"]
      resources:
        limits:
          nvidia.com/gpu: 1
          nvidia.com/gpumem: 90000
          nvidia.com/gpucores: 10
        requests:
          nvidia.com/gpu: 1
          nvidia.com/gpumem: 90000
          nvidia.com/gpucores: 10
Apply it, inspect placement, and read only this pod's events:
root@utho-gpu-rtxpro6000-8-62383:~# kubectl apply -f hami-too-large.yaml
pod/hami-too-large created

root@utho-gpu-rtxpro6000-8-62383:~# kubectl get pod hami-too-large \
  -n hami-blog-verify \
  -o custom-columns='NAME:.metadata.name,STATUS:.status.phase,SCHEDULER:.spec.schedulerName,NODE:.spec.nodeName'
NAME             STATUS    SCHEDULER        NODE
hami-too-large   Pending   hami-scheduler   <none>

root@utho-gpu-rtxpro6000-8-62383:~# kubectl get events \
  -n hami-blog-verify \
  --field-selector involvedObject.name=hami-too-large \
  --sort-by=.lastTimestamp
LAST SEEN   TYPE      REASON             OBJECT               MESSAGE
18s         Warning   FailedScheduling   pod/hami-too-large   0/1 nodes are available: 1 NodeUnfitPod. no new claims to deallocate, preemption: 0/1 nodes are available: 1 No preemption victims found for incoming pod.
18s         Warning   FailedScheduling   pod/hami-too-large   0/1 nodes are available: 1 NodeUnfitPod. no new claims to deallocate, preemption: 0/1 nodes are available: 1 No preemption victims found for incoming pod.
18s         Warning   FilteringFailed    pod/hami-too-large   1 nodes CardInsufficientMemory(utho-gpu-rtxpro6000-8-62383)
18s         Warning   FilteringFailed    pod/hami-too-large   1 nodes CardUuidMismatch(utho-gpu-rtxpro6000-8-62383)
18s         Warning   FilteringFailed    pod/hami-too-large   no available node, 1 nodes do not meet
The HAMi scheduler log makes the per-card result unambiguous:
root@utho-gpu-rtxpro6000-8-62383:~# kubectl logs \
  -n hami-system -l app.kubernetes.io/component=hami-scheduler \
  -c vgpu-scheduler-extender --tail=2000 \
  | grep '"NodeUnfitPod".*hami-too-large' | tail -1
I0723 10:27:23.686479       1 score.go:169] "NodeUnfitPod" pod="hami-blog-verify/hami-too-large" node="utho-gpu-rtxpro6000-8-62383" reason="7/8 CardUuidMismatch, 1/8 CardInsufficientMemory"
The UUID mismatch is expected for the seven cards excluded by the explicit GPU 5 pin. The matching card's decisive result is CardInsufficientMemory: 90,000 + 8,000 + 8,000 = 106,000 MiB, which exceeds its 97,887 MiB scheduling budget. The pod remains Pending and has no node because HAMi rejects it during scheduling. No container starts, so there is no CUDA or HAMi-Core OOM message in this test.
Fixed MiB or percentage? #
nvidia.com/gpumem-percentage requests a percentage of whichever card the scheduler chooses. HAMi's docs explicitly say not to combine it with fixed gpumem. On this 97,887 MiB card, a tested 50% memory request, paired with a separate 5% core request, produced:
GPU-f4c61521-...,NVIDIA,48943,5:;
GPU-f4c61521-..., 48943 MiB
Use fixed MiB when the application has a known memory requirement. Use a percentage when the intent is “half of any selected card” across a mixed-capacity fleet. The official memory allocation guide defines both forms.
How to Verify Where a Slice Landed #
With deviceSplitCount: 10, "my pod got a GPU" no longer tells you which physical card. HAMi records its placement decision in pod annotations:
POD=$(kubectl get pods -n hami-blog-verify \
  -l app=pytorch-hami-demo \
  -o jsonpath='{.items[0].metadata.name}')

kubectl get pod -n hami-blog-verify "$POD" -o json \
  | jq '.metadata.annotations | with_entries(select(.key | test("hami|gpu"; "i")))'
The annotation to look for is hami.io/vgpu-devices-allocated. Its value encodes the physical GPU UUID, vendor, memory grant, and core grant for each allocated device. Our fresh test reported GPU-04dc48d7-...,NVIDIA,8000,10:;, which maps to GPU 5 in nvidia-smi -L.
Two ways to cross-check that annotation against reality:
- From the host:
nvidia-smi --query-compute-apps=gpu_uuid,pid,used_memory --format=csvshows the physical UUID for each process. It should match the annotation. - Across replicas: compare both annotations. Same UUID means the containers share a card. For a deterministic test, use
nvidia.com/use-gpuuuid; do not keep adding replicas and hope two collide.
Software Isolation vs. Hardware Isolation #
This is the tradeoff to internalize before using HAMi for multi-tenancy:
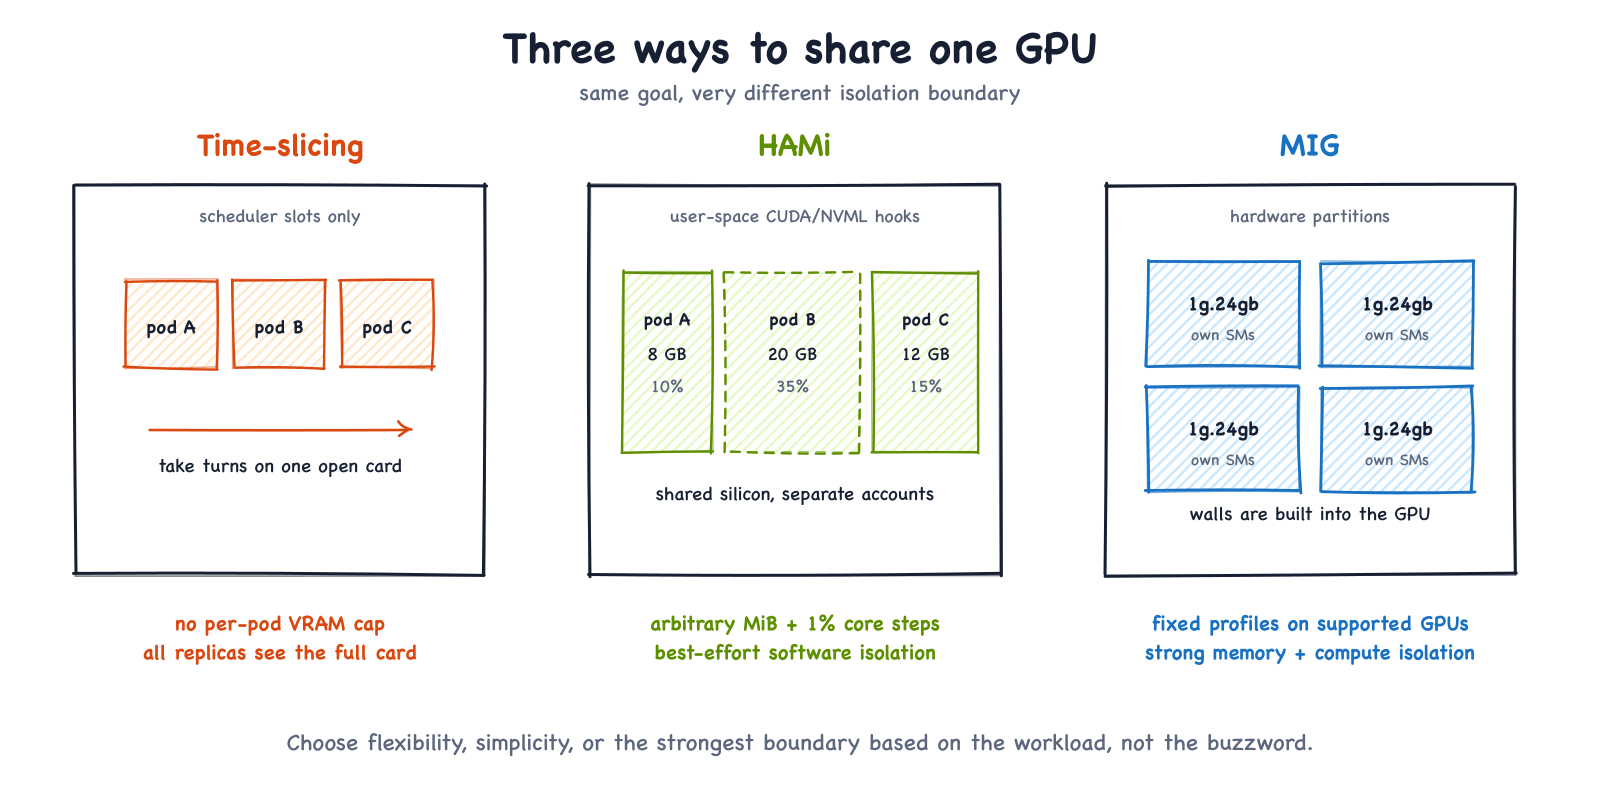
| NVIDIA time-slicing | HAMi (hami-core) | MIG | |
|---|---|---|---|
| Isolation boundary | No per-replica GPU memory/compute boundary | User-space interception through libvgpu.so and /etc/ld.so.preload | Hardware GPU instances with dedicated memory/compute resources |
| Memory shape | Every replica sees the whole card | 1 MiB request granularity | Fixed profiles such as 1g.24gb and 2g.48gb |
| Compute shape | Workloads take turns; no per-replica cap | 1% request granularity, implemented through time-based throttling | Fixed fraction of SMs in the profile |
| What the container sees | Full physical GPU | Virtual total equal to its grant | Its MIG device/profile |
| Reconfiguration | Change plugin config/redeploy affected pods | Change the workload request | Destroy/recreate affected instances; toggling mode may require a reset on Ampere |
| Important limitation | One workload can consume free VRAM needed by another workload's later allocations | Direct-driver paths, Docker-in-Docker, or CUDA_DISABLE_CONTROL=true can bypass enforcement | Requires supported GPU, driver, and profile geometry |
Time-slicing does not automatically crash every neighbor when one process gets an OOM. The precise risk is that all replicas share the same physical memory pool without per-replica caps: one workload can consume the remaining VRAM, causing later allocations in other workloads to fail.
Time-slicing shares access but does not give each pod a protected memory budget. HAMi adds software-enforced memory and compute quotas for supported CUDA workloads; in our PyTorch test, it stopped the container at its 8,000 MiB grant. The HAMi troubleshooting guide documents paths that can bypass that user-space enforcement, so HAMi should be treated as resource control rather than a hard security boundary. MIG partitions supported GPUs in hardware, providing stronger isolation and more predictable performance, but with fixed profile sizes and more involved reconfiguration. For mutually untrusted tenants, combine MIG or a dedicated GPU with the VM or host isolation appropriate to your security model.
Testing the Blast Radius: What Happens When a Pod Exceeds Its Memory Quota #
With two replicas running, each holding an 8,000 MiB / 10% grant on the same physical GPU, the question is straightforward: if one container allocates beyond 8,000 MiB, does only that allocation fail, or does the neighbor fail too?
Measured OOM sequence
One container crosses 8,000 MiB; its neighbor keeps running
Both containers share the same physical RTX PRO 6000. Their HAMi memory accounts are separate.
This test covers a normal PyTorch/CUDA allocation path. It proves the configured quota for that path; it does not prove that user-space interception is impossible to bypass.
Step 1: Spike memory usage from inside the pod #
No need to change the Deployment. Exec into one replica and retain 20,000 × 20,000 FP32 tensors until HAMi-Core refuses the next allocation. Each tensor contains 400 million four-byte values: 1.6 GB in decimal units, or about 1.49 GiB.
POD=pytorch-hami-demo-77b6f5dcd9-whrbg

kubectl exec -i -n hami-blog-verify "$POD" -- python3 - <<'PY'
import torch

tensors = []
print(
    f"Visible limit: {torch.cuda.get_device_properties(0).total_memory / 1024**2:.0f} MiB",
    flush=True,
)
try:
    for index in range(1, 9):
        tensors.append(
            torch.empty((20_000, 20_000), dtype=torch.float32, device="cuda")
        )
        torch.cuda.synchronize()
        allocated = torch.cuda.memory_allocated() / 1024**2
        print(f"block {index}: {allocated:.0f} MiB allocated", flush=True)
except torch.OutOfMemoryError as error:
    print("HAMi boundary reached: CUDA out of memory", flush=True)
    print(str(error).split(". If reserved")[0], flush=True)
PY
The main matmul process already held about 2.06 GiB, and the exec process shared the same container budget. The command returned:
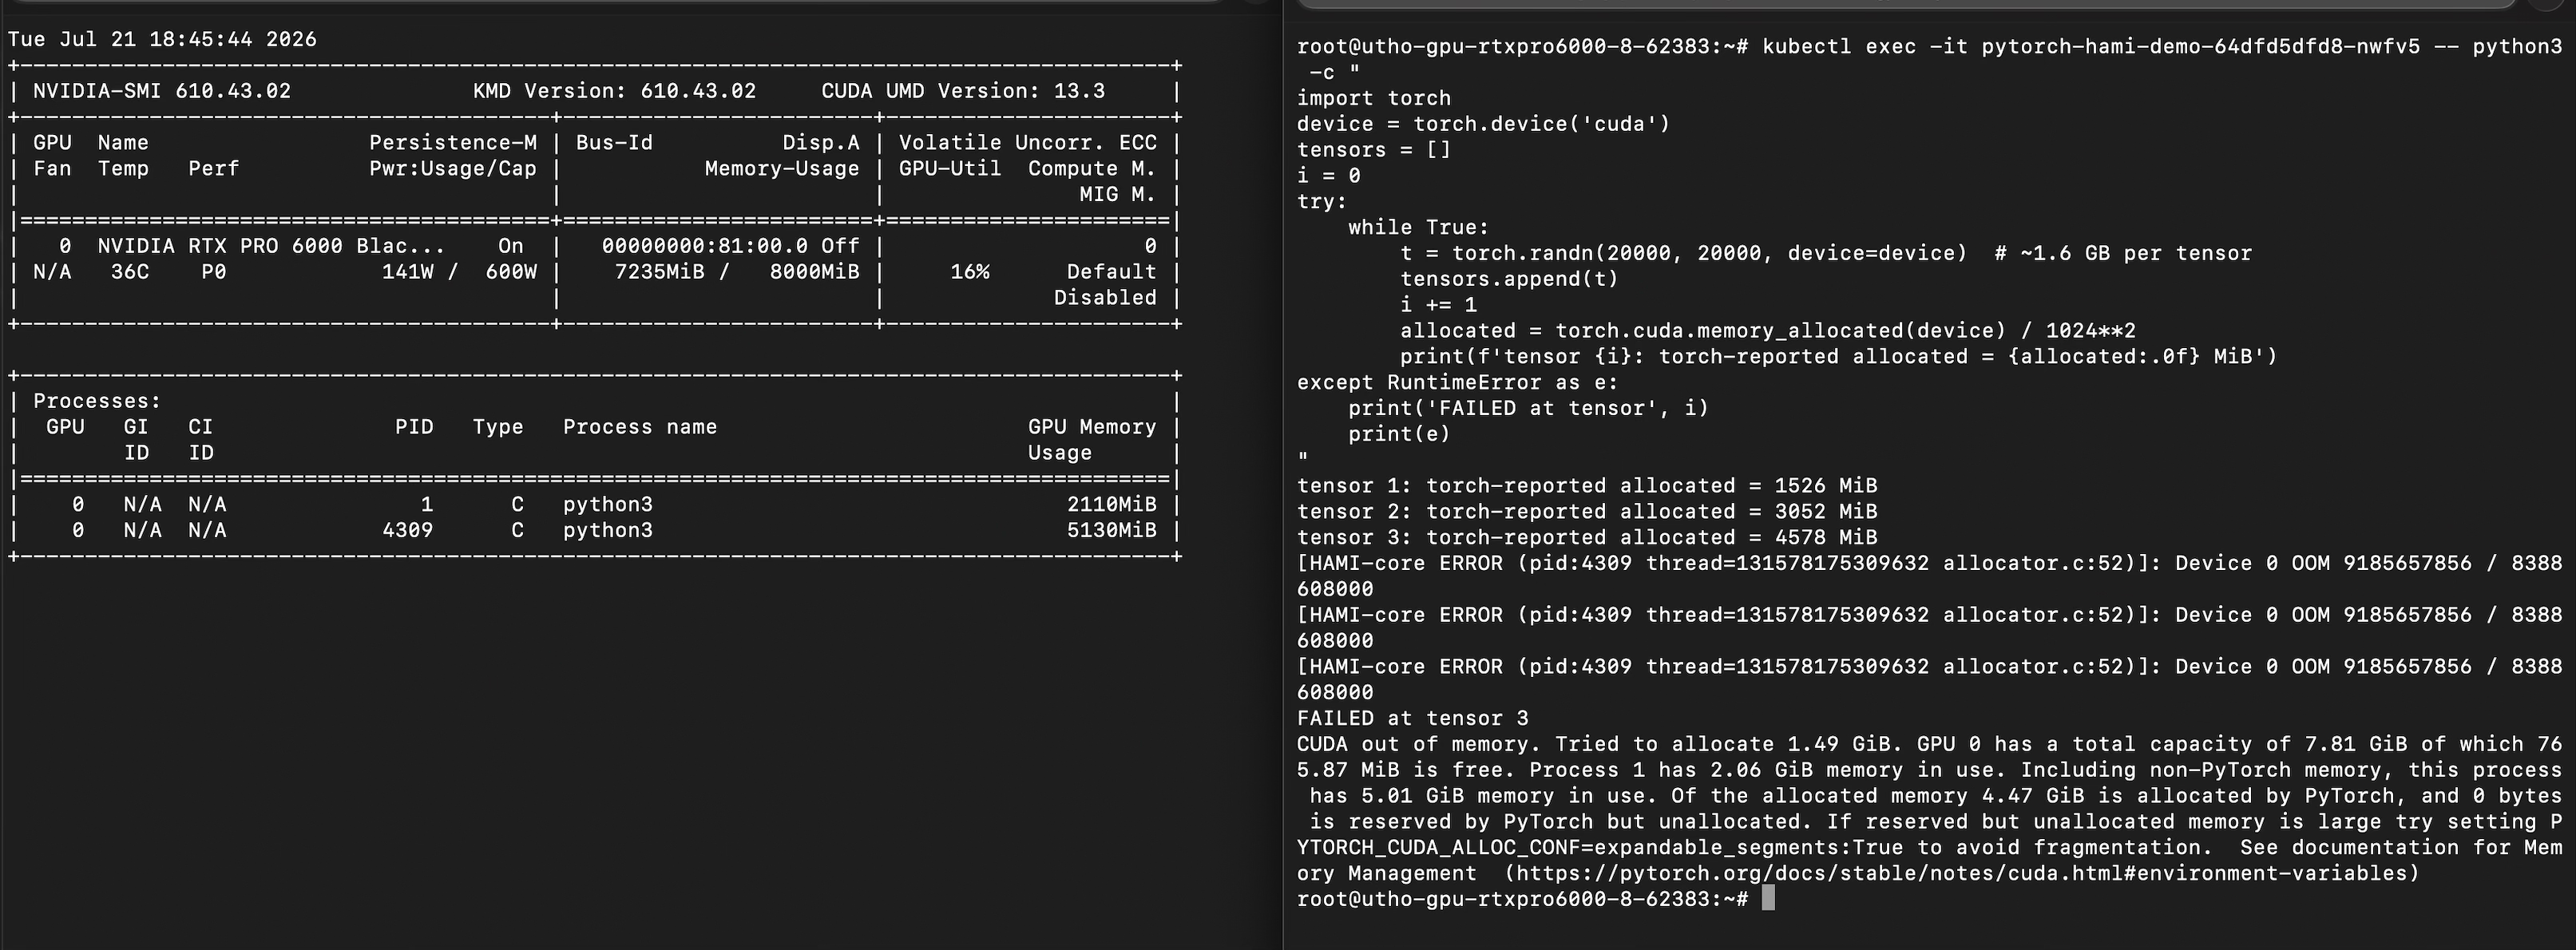
Visible limit: 8000 MiB
[HAMI-core ERROR (pid:563 thread=134804753249792 allocator.c:52)]: Device 0 OOM 9185657856 / 8388608000
[HAMI-core ERROR (pid:563 thread=134804753249792 allocator.c:52)]: Device 0 OOM 9185657856 / 8388608000
block 1: 1526 MiB allocated
block 2: 3052 MiB allocated
block 3: 4578 MiB allocated
HAMi boundary reached: CUDA out of memory
CUDA out of memory. Tried to allocate 1.49 GiB. GPU 0 has a total capacity of 7.81 GiB of which 765.87 MiB is free. Process 1 has 2.06 GiB memory in use. Including non-PyTorch memory, this process has 5.01 GiB memory in use.
The two identical raw HAMi-Core lines came from the intercepted allocation path; the script then caught PyTorch's OutOfMemoryError and printed the readable summary. The first three new tensors succeeded. The fourth allocation would have pushed HAMi's tracked total to 9,185,657,856 bytes against an 8,388,608,000-byte limit, exactly 8,000 MiB. PyTorch sees 7.81 GiB because GiB uses powers of 1024. The card itself was nowhere near its 97,887 MiB physical limit, so this was a software quota verdict rather than a physical-card OOM.
Step 2: Check the offending container, neighbor, and host #
# 1. Virtualized view inside the offending container.
kubectl exec -n hami-blog-verify pytorch-hami-demo-77b6f5dcd9-whrbg -- \
  nvidia-smi --query-gpu=uuid,memory.total,memory.used --format=csv

# 2. Real processes and physical UUID from the host.
nvidia-smi --query-compute-apps=gpu_uuid,pid,used_memory --format=csv

# 3. Pod state and restart count for both replicas.
kubectl get pods -n hami-blog-verify -l app=pytorch-hami-demo \
  -o custom-columns='NAME:.metadata.name,STATUS:.status.phase,RESTARTS:.status.containerStatuses[0].restartCount'

# 4. The neighbor's virtualized memory after the failed allocation.
kubectl exec -n hami-blog-verify pytorch-hami-demo-77b6f5dcd9-wx677 -- \
  sh -c 'nvidia-smi --query-gpu=uuid,memory.total,memory.used --format=csv,noheader 2>/dev/null'
The terminal view below shows the same virtual capacity and rejected allocation:
The fresh post-test checks returned:
NAME                                 STATUS    RESTARTS
pytorch-hami-demo-77b6f5dcd9-whrbg   Running   0
pytorch-hami-demo-77b6f5dcd9-wx677   Running   0

GPU-04dc48d7-7048-aef5-ad36-f5db716e7668, 8000 MiB, 2107 MiB- Offending container: HAMi-Core returned OOM at its 8,000 MiB account boundary.
- Neighbor: remained
Running, had zero restarts, and still reported 2,107 MiB used of its own 8,000 MiB grant. - Host: showed both long-running processes on GPU 5. Physical memory headroom did not override the container limit.
- Application behavior: this exec script catches the
RuntimeError, so the pod stays alive. An uncaught OOM may terminate the process and trigger whatever restart policy the workload defines.
The result is deliberately narrow and useful: for this PyTorch/CUDA path, the memory overrun was contained to the offending container's allocation and the neighbor continued running. The boundary is still a user-space contract, not a MIG hardware partition.
Monitoring the Slices #
A one-off test is not an operations strategy. HAMi exposes two Prometheus-format endpoints: one for allocation decisions and one for live usage. Prometheus/Grafana are still separate components if you want storage, alerting, and dashboards.
Do not guess the ports from an old example. Check the Services installed by your chart:
root@utho-gpu-rtxpro6000-8-62383:~# kubectl get service -n hami-system
NAME                         TYPE       PORT(S)
hami-device-plugin-monitor   NodePort   31992:31992/TCP
hami-scheduler               NodePort   443:31998/TCP,31993:31993/TCP
The scheduler's view: cluster-wide allocation state, exposed by the hami-scheduler service (NodePort 31993 by default):
curl http://127.0.0.1:31993/metricsThis answers allocation questions: how much of each physical card's memory/core budget is promised (hami_gpu_memory_allocated_bytes, hami_gpu_core_allocated_ratio), how many containers share it (hami_gpu_shared_count), and which pods own each grant. With two 8,000 MiB / 10% containers on GPU 5, the scheduler endpoint reported an aggregate 16,000 MiB and 20% reservation:
hami_gpu_core_allocated_ratio{device_index="5",device_uuid="GPU-04dc48d7-..."} 20
hami_gpu_memory_allocated_bytes{device_cores="20",device_index="5",device_uuid="GPU-04dc48d7-..."} 1.6777216e+10
The official cluster allocation metrics reference documents the metric names and labels.
The node's view: real-time per-container usage, exposed by the vgpu-monitor sidecar through NodePort 31992 on this chart:
curl http://127.0.0.1:31992/metricsThis is the usage-side counterpart. For the unaffected neighbor, it reported about 2.21 GB used against an 8.39 GB byte limit:
hami_container_device_memory_bytes{namespace="hami-blog-verify",pod="...-tj9rg"} 2.208433152e+09
hami_vgpu_memory_limit_bytes{namespace="hami-blog-verify",pod="...-tj9rg"} 8.388608e+09
The current real-time usage reference lists host, container, memory, and utilization metrics. Alert on both dimensions: allocated tells you what the scheduler has promised; used tells you what applications actually consume.
Wire both endpoints into Prometheus and a few panels give you the dashboard a shared-GPU platform actually needs. A useful layout keeps fleet capacity, per-pod grants, and per-GPU allocation visible together:
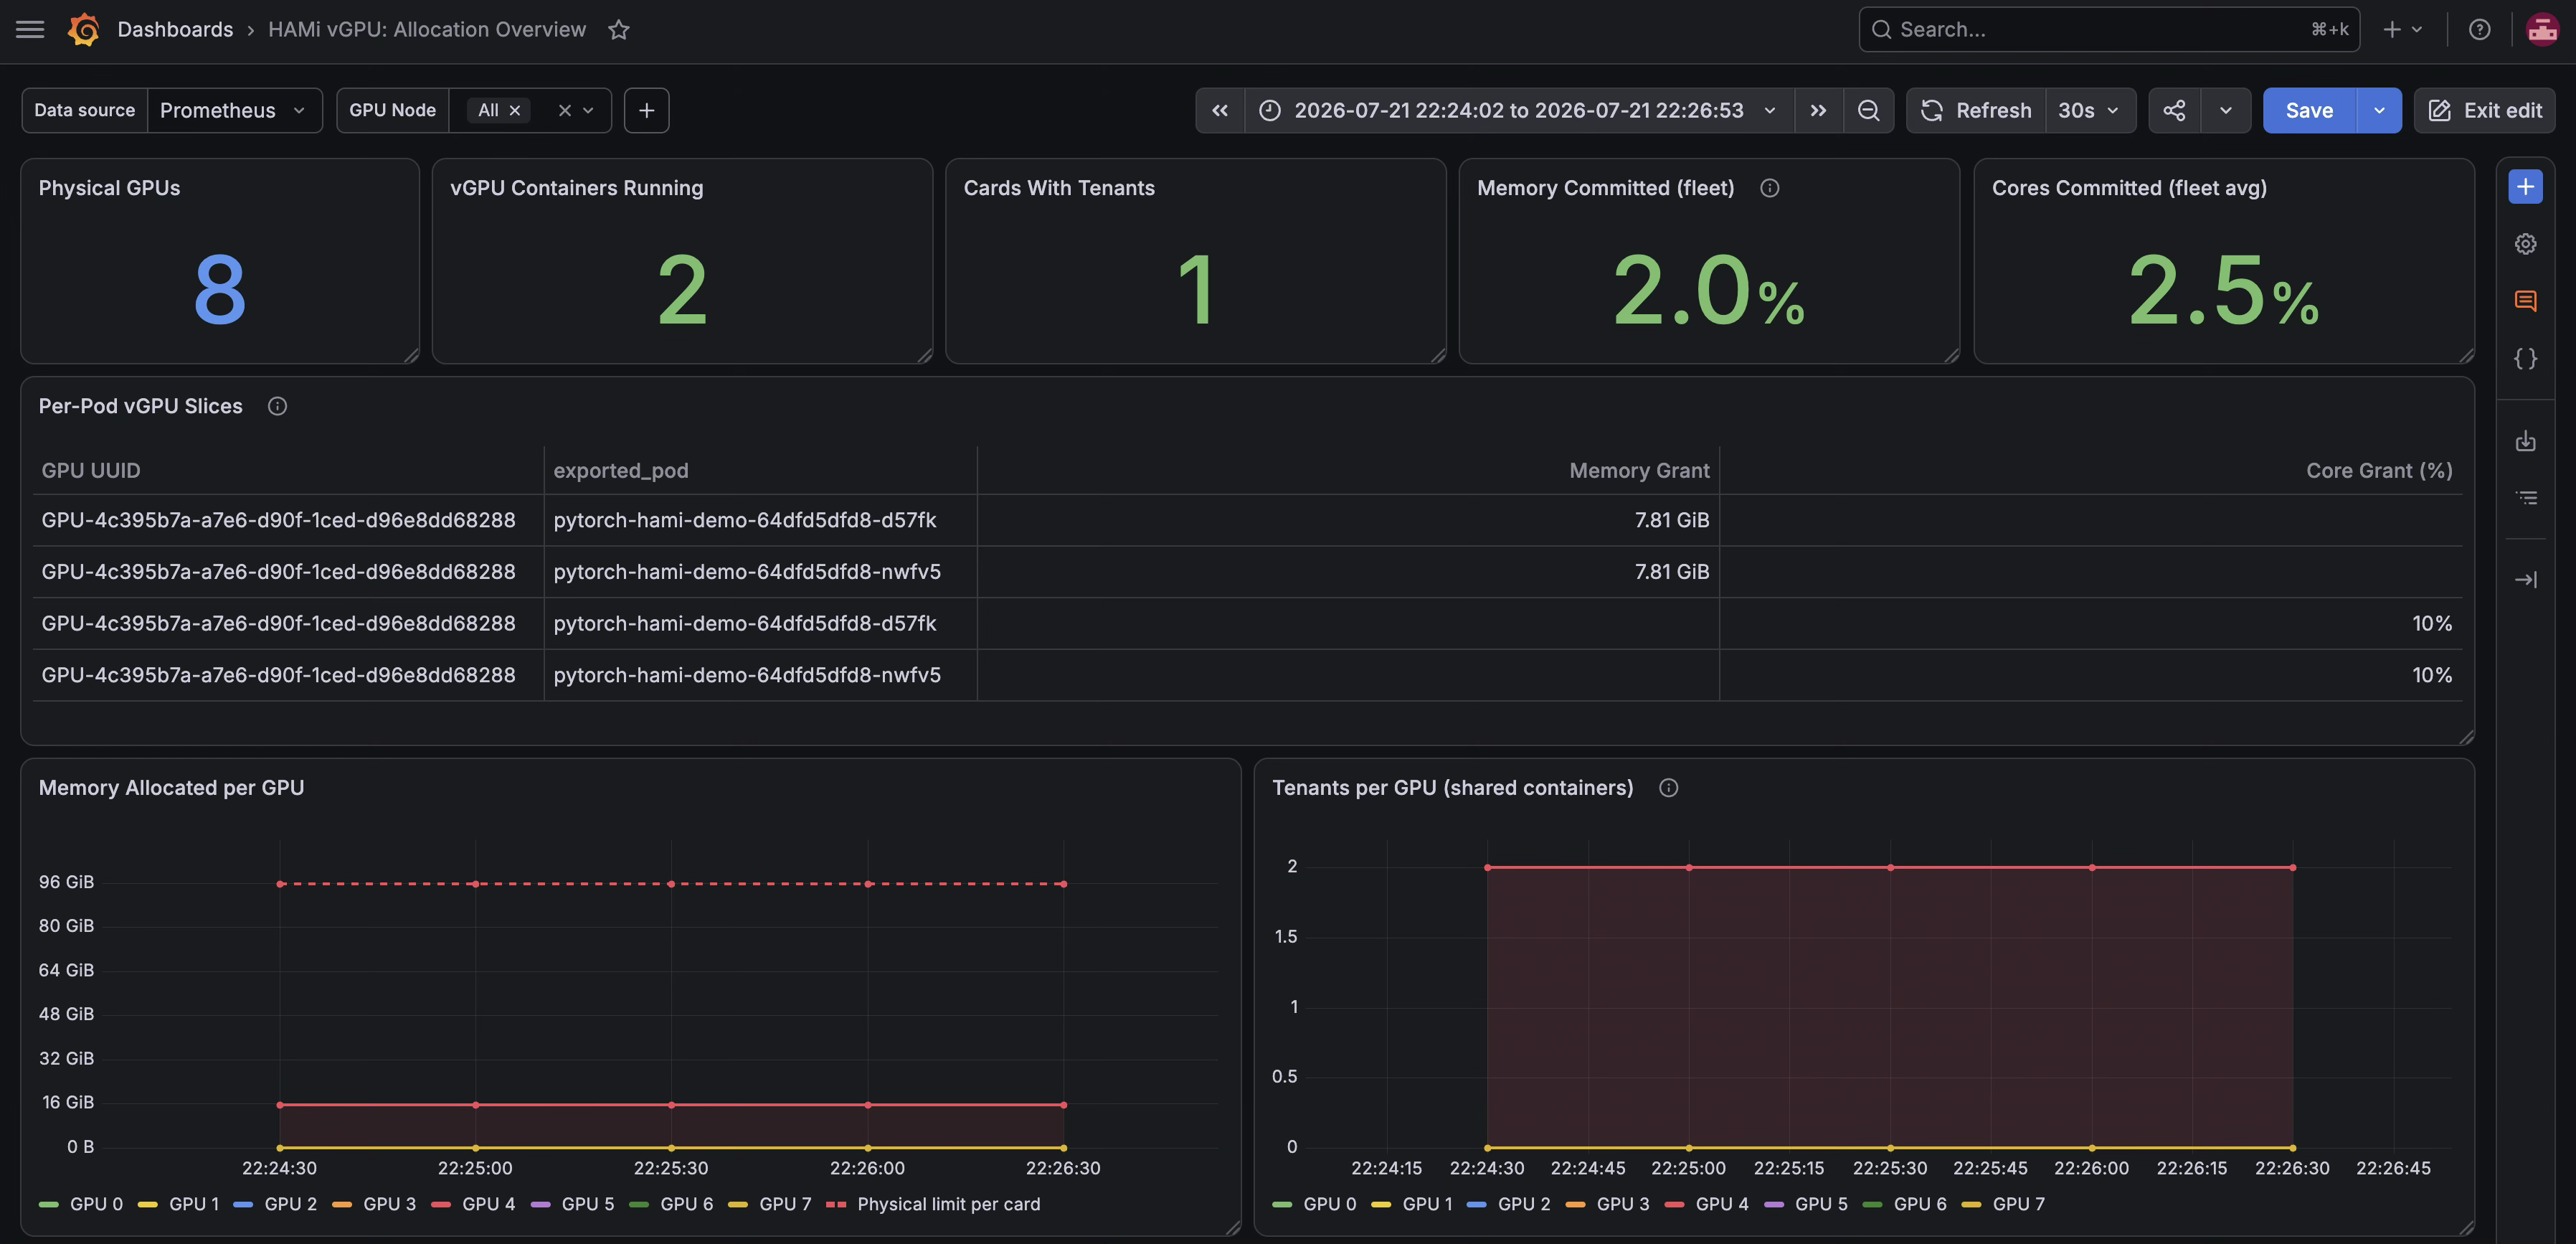
The dashboard is useful because it keeps three different numbers separate: physical cards, logical sharing slots, and actual resource grants. Mixing those is how an eight-GPU node gets mistaken for an 80-GPU node.
Once the outputs were captured, the temporary workloads were removed while the clean HAMi installation remained running:
kubectl delete namespace hami-blog-verify --wait=trueCommon Pitfalls and How to Solve Them #
Pitfall A: Assuming nvidia.com/gpu Count Reflects Physical GPU Count #
The first time you see nvidia.com/gpu: 80 on an 8-GPU node, it's easy to assume something is broken. Here, all eight whole GPUs are registered and each contributes ten logical slots. Check the hami.io/node-nvidia-register annotation before assuming a misconfiguration; the number of GPU entries and the "count" field per entry explain the capacity.
Pitfall B: Expecting nvidia.com/gpu: 1 Alone to Mean “One Tenth” #
HAMi documents nvidia.com/gpu without memory/core fields as exclusive-GPU mode. I tested it on idle GPU 6; the allocation annotation was GPU-f4f5db98-...,NVIDIA,97887,100:;, and nvidia-smi inside the container reported all 97,887 MiB. If you intend to share, state gpumem and/or gpucores explicitly.
Pitfall C: Treating requests and limits Differently #
Kubernetes extended resources cannot be overcommitted like CPU. Put the HAMi resources in limits; if you include requests, use the same values. A mismatched manifest is rejected before HAMi can schedule it.
Pitfall D: Removing runtimeClassName Without Checking the Runtime #
Our manifest has no runtimeClassName because containerd's default is already nvidia and the HAMi chart did not create one. That is a property of this installation, not a universal copy/paste rule. A GPU Operator cluster may have nvidia or CDI-related RuntimeClasses, while an NRI-enabled Operator cluster may intentionally have none. Check kubectl get runtimeclass, containerd config dump, and your Operator mode before copying the field. A reference to a nonexistent runtime handler prevents the pod sandbox from starting.
Pitfall E: Blaming HAMi for a Slow First Deployment #
The NGC PyTorch image used above is a multi-gigabyte pull. On a fresh node, the pod will sit in ContainerCreating for several minutes while containerd downloads it, which looks a lot like a scheduling or webhook failure if you're watching for HAMi problems. kubectl describe pod disambiguates instantly: a Pulling image event means wait; a FilteringFailed event with CardInsufficientMemory means the selected card cannot fit the request alongside its existing tenants.
Pitfall F: Treating HAMi-Core Limits as Hardware-Equivalent to MIG #
As covered above, plan your multi-tenancy story around what hami-core actually demonstrated here (per-container quota enforcement through supported CUDA runtime and NVML paths), not around MIG's stronger silicon-level isolation. For adversarial or security-sensitive workloads, use MIG or dedicated GPUs together with the VM or host isolation required by your threat model.
Conclusion #
HAMi trades MIG's hardware boundary for flexibility: memory in 1 MiB units, compute in 1% steps, and limits that change with the workload spec instead of a hardware repartition.
Here's what this setup walked through:
- Built a clean Kubernetes v1.35.6 node, configured the NVIDIA default runtime, and installed HAMi v2.9.0 as Helm revision 1.
- Traced the live
nvidia.com/gpu: 80to eight registered whole GPUs withdeviceSplitCount: 10, separating logical concurrency from physical capacity. - Ran two fresh PyTorch replicas on one explicitly pinned GPU, each with an 8,000 MiB / 10% grant.
- Proved that an unfit 90,000 MiB request stayed Pending with
CardInsufficientMemory, even though logical count slots remained. - Reproduced HAMi-Core rejecting an attempted 9,185,657,856-byte total against an 8,388,608,000-byte grant while the neighboring container remained Running with zero restarts.
- Tested the two easy-to-misunderstand resource forms: GPU-only produced an exclusive 97,887 MiB / 100% allocation, and a 50% request produced 48,943 MiB.
- Queried the live allocation endpoint on
31993and usage endpoint on31992, then checked the corresponding Grafana view.
The payoff is fractional, self-service GPU access without pretending software quotas are silicon walls. For cooperative notebooks, CI jobs, and inference services, that can recover a great deal of stranded capacity. For strict QoS, choose MIG. For mutually untrusted tenants, pair MIG or dedicated GPUs with an appropriate VM or host boundary.
HAMi is a CNCF Incubating project. The docs live at project-hami.io and the source at github.com/Project-HAMi/HAMi. For the hardware-isolation side of this story, continue with our MIG deep dive.
Thanks to our hardware partner
This deep dive ran on an 8x NVIDIA RTX PRO 6000 Blackwell node from Utho Cloud. If you need GPU infrastructure to run workloads like these, take a look.
Explore UthoBuilding Hybrid K8s Platforms @trivago | Tech Author & Speaker (freeCodeCamp, SREDays) | vCluster Ambassador | RHCA & GCP DevOps Professional
Saiyam is working as Head of DevRel at vCluster Labs. He is the founder of Kubesimplify, focusing on simplifying cloud-native & AI infrastructure. He is KubeCon Co-chair and has worked on many facets of Kubernetes, including machine learning platforms, scaling, multi-cloud, & managed Kubernetes services. When not coding, Saiyam contributes to the community by writing blogs and organizing local meetups for Kubernetes and CNCF. He is also a CNCF TAG OpsRes Chair & can be reached on Twitter @saiyampathak.
Get new posts in your inbox.
Spotted a typo or want to improve this post? Edit on GitHub →